X-ray Diffraction
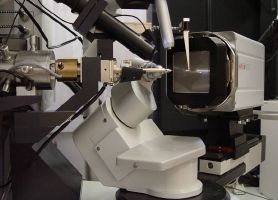
In this image of from BYU's x-ray diffraction facility, x-rays arriving from the left scatter in all directions from a tiny crystal at the center, and are then imaged by a 16-megapixel x-ray camera. The often beautiful scattering patterns that result contain a wealth of information about the atomic structure of the sample. The speed and sensitivity of state-of-the-art instruments like this have revolutionized the study of crystalline materials. The stainless-steel cylinder with lots of knobs is a double focusing Kirkpatrick-Baez mirror, which increases the intensity of the x-ray beam by a factor of 8. The beam collimator (left), the goniometer head (back), the microscope (45°), the low-temperature gas nozzel (vertical), and a beam stop (right) all point towards the location of the sample.
The spatial distribution of scattered x-rays is closely related to the Fourier transform of the crystal's electron density. In principle, an inverse Fourier transform can be used to directly convert experimental scattering data into a picture of the electron density (i.e. the atomic crystal structure). Of course, the Fourier Transform of the electron density is a complex-valued function, only the magnitude of which is actually measured. Hence the "phase problem" of crystallography.
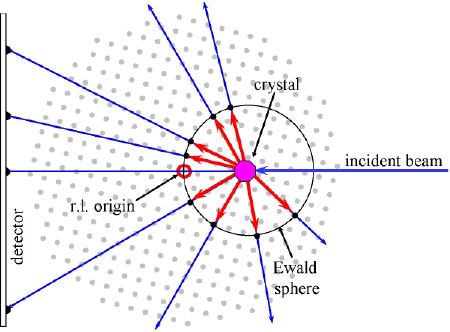
In the figure below, the lattice of grey dots represents the Fourier transform of a simple cubic crystal with one atom per repeating unit cell. Because the Fourier transform of any periodic function (crystals are periodic by definition) is a discrete lattice of uniformly spaced peaks, we call this the reciprocal lattice. The individual peaks are called Bragg peaks. In the figure, the reciprocal lattice and the real-space laboratory configuration have been superimposed (don't try this at home!) to illustrate the geometry of a diffraction experiment. Note that when the crystal rotates on the diffractometer, its reciprocal lattice rotates with it, but around a different origin. The well-known Bragg diffraction equation, 2dsin(q) = l, is actually the equation for a sphere of radius 1/l with it's edge just touching the origin of reciprocal space. We have included this imaginary "Ewald sphere" in the figure. As the crystal rotates on the goniometer, any Bragg peak that comes into contact with the surface of the Ewald sphere satisfies the diffraction condition and results in a diffracted x-ray beam that leaves the crystal in the direction of the peak. When diffracted beams intersect the x-ray detector surface, their locations and intensities are recorded. Click on the figure to see an interactive flash animation of a single-crystal diffraction experiment. Choose a crystal type and orientation to start the animation.
The animation makes the Ewald sphere look something like a disco ball. So now we have Disco Diffraction!