The Balloon Lens
Like many research projects, this started out as something simple that rapidly grew into something much more complex in order to obtain a satisfactory explanation. The goal was to take a gas-filled balloon, which had been previously described as an acoustic lens, and experimentally verify the ball lens equations used in optics. What we found was that although a heavier gas with a lower sound speed than air resulted in a focusing region, the geometric approximation was a relatively poor one. More sophisticated methods were required to explain what had been described as a simple behavior. A chance discussion with Dr. Steve Turley during an AAPT workshop put us on the right track and resulted in a jointly authored paper that was the cover article for the March 2009 issue of American Journal of Physics. See publication #16 in Publications.
Experiment and Modeling
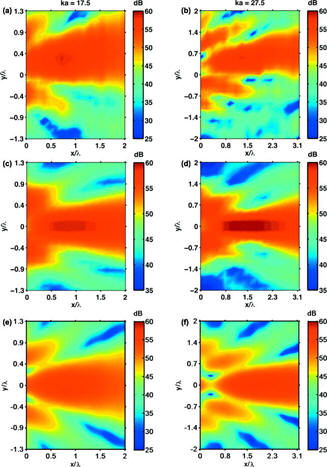
We set up a carbon dioxide-filled balloon in the BYU anechoic chamber in the far field of a loudspeaker. An array of microphones was used to scan the focal region on the far side of the balloon, as described in the figure to the left. We discovered the presence of lobing patterns that suggested multipath interference similar to scattering. This led to the development of an analytical model based on scattering through a transmissable sphere and a qualitative confirmation of the phenomenon using a 2-D numerical solution based on a staggered leapfrog algorithm. Results are shown for the experiment (top), 2-D numerical solution (middle) and analytical model (bottom) at two different non-dimensionalized frequencies (left and right). The agreement between the analytical model and the experiment shows that the balloon "lens" must be treated as a scatterer at the frequencies of interest, making it an object worthy of more in-depth discussion than one described by geometric acoustics.